Skip to content

Walmart’s Food & Beverage Pricing Volatility: What Tariffs Are Hiding

Tariff policies have been anything but steady in 2025 — shifting, pausing, and updating multiple times. In our last two posts, we explored how Amazon categories reacted. Now, we turn to Walmart’s Food & Beverage aisle, where between January and July 2025, price swings were striking. Using Traject Data’s Bluecart ecommerce scraping pricing API, we tracked Walmart’s prices to uncover how tariffs and promotions are shaping category-level volatility

In most subcategories, nearly 4 in 5 products shifted 30% or more from their starting price. Such movements are more than noise — they’re an early warning for supply chain leaders, category managers, and pricing teams to adjust sourcing strategies and prepare for downstream retail pricing shifts.

Among them, Sweet Snacks stood out not just for volatility, but for scale. With the largest product count in the category — followed by Beverages and Bakery Products — its price movements carried more weight across Walmart’s assortment.

What the Data Shows

  • Volatility is widespread: Nearly 80% of products in Walmart’s Food & Beverage subcategories saw swings of 30% or more from their January baseline. The risk of major pricing shocks isn’t confined to niche segments — it’s spread across the aisle.
  • Movement is persistent: Prices didn’t just shift once and settle. They kept moving throughout the first half of the year. Some categories saw sharper, more frequent changes than others, signaling the market is still in flux and may require ongoing pricing adjustments.

Risk Categories

Volatility Watch: % of SKUs Shifting More Than 30%

Tracking price changes with ecommerce web scraping apis

Volatility is high across the aisle, but not all subcategories move the same. Sweet Snacks, Beverages, and Bakery Products lead in swings, while Dairy and Frozen Foods lag slightly — a signal that some areas react faster to cost, supply, or promotional changes than others.

Price Trajectory for Sweet Snacks

Month-over-month % change highlighting post-Q1 rebound and sustained increases through Q2

Tracking price changes with ecommerce web scraping apis

At the start of the year, Sweet Snacks prices held steady, then fell by about 3% in March compared to February. Interestingly, this dip coincided with Walmart’s online-only Super Savings Week (March 24–April 1), a major promotional event that likely contributed to lower prices, alongside seasonal sales, category-specific discounts, or clearance activity.

By April, prices stabilized as the market adjusted to evolving cost structures and promotional pressures. For context — though not direct causation — this March dip and April pause occurred just after early-March tariff implementations (following late-February announcements), and the April 9 decision to pause most reciprocal tariffs globally for 90 days while sharply raising rates on Chinese goods.

From May through July, prices climbed steadily. This rebound may reflect the pullback from heavy discounting, supply chain recalibrations, and tariff-driven cost pass-through to retail pricing.

The pattern raises a critical question:
Are tariff-driven disruptions in your category being masked by short-term promotional dips — only to emerge later as sustained price increases?

Why Ecommerce Scraping Pricing APIs Matter

Tracking these rapid shifts manually is impossible. Price changes driven by tariff policies, promotions, and supply chain resets can unfold daily across thousands of SKUs.

That’s where an ecommerce scraping pricing API becomes essential. With real-time monitoring, teams can:

  • Detect category volatility before it erodes margins
  • Compare competitive pricing across marketplaces like Walmart and Amazon
  • Adjust sourcing strategies based on tariff-driven cost fluctuations
  • Respond to promotions quickly instead of reacting weeks later

Traject Data’s ecommerce APIs give retailers, manufacturers, and brand protection teams the ability to monitor price movements at scale — providing early warnings of volatility and helping teams move from reactive to proactive.

What Walmart’s Tariff-Driven Price Swings Mean for Your Ecommerce Strategy

Walmart’s Food & Beverage price patterns show how quickly category-level shifts can ripple through entire assortments. From sharp swings to subtle month-over-month climbs, these movements call for:

  • Faster pricing updates
  • Closer supplier coordination
  • More agile promotion strategies

Even small changes in high-volume categories can compound into margin risk. Real-time monitoring with an ecommerce scraping pricing API ensures you catch the change early enough to act.

“Nearly 80% of Walmart’s Food & Beverage products swung more than 30% in just six months. That’s not volatility to watch — that’s volatility to act on. Tariff shifts and promotions don’t just move prices in the moment, they set the stage for months of margin pressure or opportunity.”

— Ria Delamere, CTPO, Traject Data

Use an Ecommerce Scraping Pricing API to Stay Ahead of Tariffs

Get the complete dataset or run a custom volatility scan for your categories of interest. With Traject Data’s ecommerce APIs, you can identify products most at risk of tariff-driven price shocks and protect your margins.

👉 Learn more about Traject Data’s ecommerce scraping pricing APIs

Want to explore more on price tracking after tariff changes? Check out our earlier posts:

Same Furniture, Higher Prices: What Our Ecommerce Scraping API Found

In a previous blog post, we took a broad look at how recent tariff changes were shaking up product prices and inventory for Acme Furniture across Amazon. We gave you a snapshot of the market using data from our ecommerce scraping API, tracking how tariffs ripple through ecommerce supply chains in real time. 

This time, we’re zooming in.

Previously, we looked at Acme Furniture’s overall brand performance across two suppliers. Now, we’re peeling back the layers to focus on specific subcategories and eventually drilling all the way down to individual SKUs. Think of it like peeling an onion—layer by layer—until we uncover exactly how tariffs are shaping ecommerce pricing.

Focusing on the Essentials

Acme Furniture sells a wide range of products, but for this post, we’re focusing on three high-impact categories:

  • Bedroom Furniture
  • Dining Room Furniture
  • Living Room Furniture

We chose these categories because they represent the essential pieces that make up any home.So when prices shift in these categories, the ripple effects touch both consumers and sellers across the ecommerce ecosystem.

Here’s what we found using our ecommerce API to monitor Amazon product pricing in real time.

A Closer Look at Price Trends

As you can see from the chart (below), all three furniture categories saw significant price increases between February and March:

  • Bedroom Furniture: Prices surged from around $700 in January to over $1,100 by May before dipping slightly to $800 in June.
  • Dining Room Furniture: Prices climbed from $800 in January to nearly $1,000 by March.
  • Living Room Furniture: Starting at about $400, prices nearly doubled to $800 in the same period.
Web scraping to track price changes

All three categories are trending upward. That matters because these aren’t specialty goods—they’re core household items.

For consumers, that means everyday furniture is becoming harder to afford.
For retailers, it means rethinking pricing, sourcing, and promotion strategies.

From Category to SKU: Zooming in on Bedroom Furniture

Bedroom furniture experienced the most dramatic price swings of all three categories. Let’s take a deeper look at two specific products—tracked over six months—to illustrate how price shifts are playing out on the product level.

Product 1: Bed Frame

In January, this basic full bed frame was priced at $258.84. While it ticked up slightly in February, the real jump came in April when it jumped to $301.41. By June, the price hit $348.40—a 34.6% increase over just six months. That’s not a luxury bed. That’s just a place to sleep. And it’s now $90 more expensive than it was in January.

Tracking Price Shifts in Your Home: What’s Changed from January to June

Web scraping ecommerce API tracks prices after tariff increases

Product 2: Chest of Drawers

This item tells an even more dramatic story. It was priced at $1,102.90 in January and reached $1,638 by June—a staggering $535 increase.

For families furnishing an entire home, that kind of increase can be a deal-breaker.

Web scraping ecommerce API tracks prices after tariff increases

“We’re watching essentials get priced like premium goods. Tariffs are a big part of the story. When a basic chest of drawers climbs $500 in six months, retailers can’t afford to rely on assumptions. These aren’t broad inflation trends; they’re specific, SKU-level shifts driven by sourcing decisions and policy changes. Having raw, real-time data lets retailers spot these price movements early, adjust strategies accordingly, and avoid being caught flat-footed as the middle market gets increasingly volatile.”

— Heather Wold, Group Product Manager, Traject Data

Regional Price Differences: Same Product, Different Costs

Our ecommerce APIs don’t just track pricing across retailers—they also track geographic variation.

For this analysis, we looked at prices across three major U.S. cities (Chicago, New York, Los Angeles) and one Canadian location (Amazon.ca). Even for the same product, pricing varied by location.

Bed Frame by City

At first, prices across Chicago, NYC, and LA were relatively stable. But starting in March:

  • Chicago & NYC stayed in a similar range
  • Los Angeles showed a steeper price climb

This could reflect regional shipping costs, local demand, or warehouse availability. But the takeaway is clear: even the same product on the same platform (like Amazon) doesn’t cost the same everywhere.

Web scraping ecommerce API tracks prices after tariff increases

Chest of Drawers by City

This product followed a similar trend—especially in LA:

  • All cities started near the same price point in January
  • Prices began rising in February
  • Chicago and NYC spiked in May
  • LA consistently trended higher

There’s volatility across the board, but LA appears to lead the pack in price increases.

Web scraping ecommerce API tracks prices after tariff increases

While it’s clear that all cities experienced price increases, understanding the nuances behind regional trends requires more analysis across a wider range of products. For now, it’s evident that geographical factors contribute to varying price points, and consumers in different locations may experience different affordability challenges based on these shifts.

The Bigger Picture: What It Means for Ecommerce

This deep dive into Acme Furniture is just a preview of what’s possible with modern ecommerce scraping apis.

Web scraping for ecommerce is no longer about just monitoring availability or reviews—it’s a critical strategy for tracking pricing dynamics, SKU-level shifts, and competitive positioning in real time. Whether you’re a retailer, brand protection team, or data analyst, tools like the Rainforest API by Traject Data let you move beyond assumptions and act on accurate, granular insights.

What’s Next?

So far, we’ve looked at:

  • One brand: Acme Furniture
  • One source country: China
  • One retailer: Amazon
  • Three cities: Chicago, NYC, and LA

There’s still so much more to explore:

  • How do products sourced from Vietnam compare?
  • Are groceries and clothing seeing similar trends?
  • How do these price shifts play out on other retailers?
  • How volatile is pricing on a week-to-week basis?

Stay tuned. In upcoming posts, we’ll broaden the lens to include more categories, more countries of origin, and more retailers—delivering fresh insights powered by our ecommerce web scraping APIs.

Want to Track Ecommerce Prices in Real Time?

Traject Data’s Rainforest API and ecommerce scraping APIs are built for businesses that need high-resolution, real-time ecommerce data. Whether you’re tracking price trends, detecting MAP violations, or monitoring the impact of tariffs, our tools give you the competitive edge.

Learn more about our ecommerce APIs

Traject Data eCommerce APIs

Complete real-time ecommerce product information scraper APIs for product development, price strategy and market research.

Explore the APIs

How Ecommerce APIs Reveal Tariff Impacts on Amazon Prices and Supply Chains

At the start of this year, we began tracking approximately 10,000 products across three major U.S. retailers: Amazon, Walmart, and Target. Why? Because the trade landscape was already heating up. With headlines swirling about shifting tariff policies, changes in import duties, and the mounting pressure on global supply chains, we wanted to see how these forces were playing out, not just at a macro level, but on the product pages themselves.

We didn’t begin with a specific hypothesis or assumption. We decided to watch the data and see what patterns emerged.

Now, six months in, there are plenty of questions to explore. Did prices jump? Did products go out of stock? Were marketplaces absorbing the shock? Were certain products, suppliers, or regions reacting faster than others? Were specific categories hit harder than others? And when did these shifts appear — immediately or much later, after the policies were implemented?

In this post, we’ll zoom in on a single retailer: Amazon, and a subset of products (ACME Furniture) tied to two key sourcing countries: China and Vietnam. The data showed a clear pattern of disruption and two very different reaction timelines. One sharp and early. One slower, but still consequential.

The Immediate Impact: Early Movements Observed in Products Sourced from China

January–March

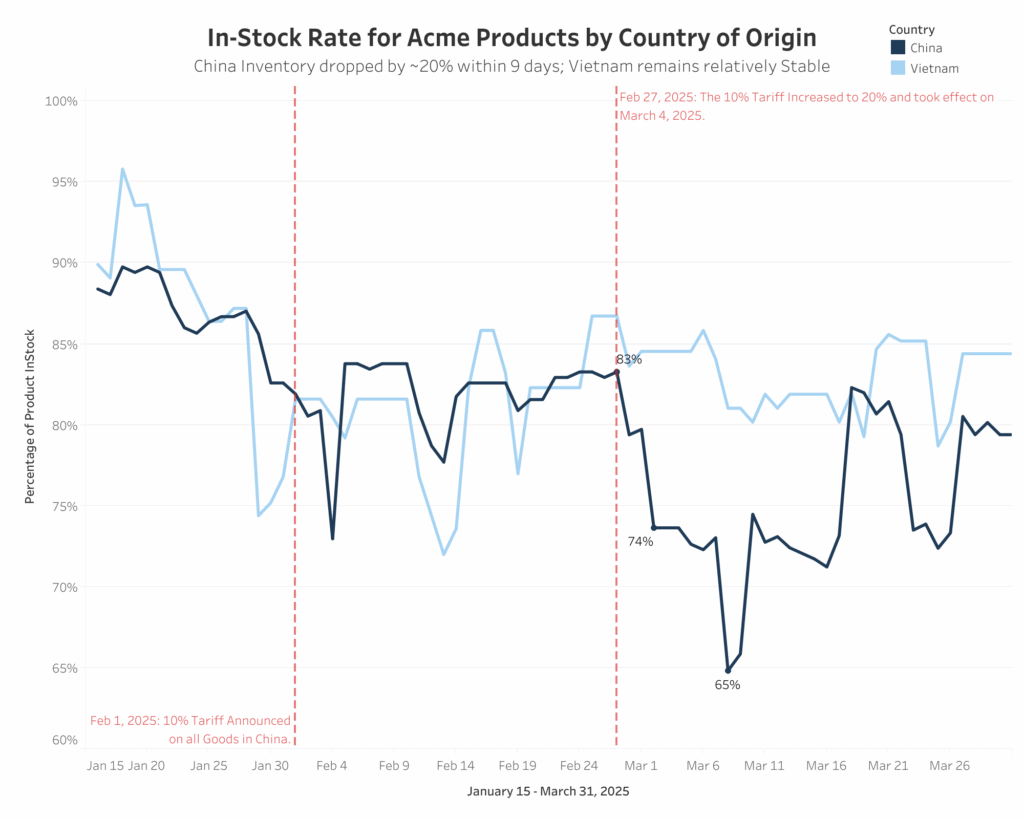
Back in January, prices and inventory levels for Acme-branded products on Amazon looked pretty stable. Products sourced from China and Vietnam hovered around the same price range, roughly $740–760, and inventory levels were strong, with over 80-85% of items in stock.

The first signs of stress

News of upcoming tariffs began circulating by the end of January, and on February 1, 2025, a 10% tariff on all Chinese imports was announced. An additional 20% was officially announced on February 27. Although the tariff wasn’t implemented until March 4, we noticed a sharp drop in availability almost immediately after the February 27 announcement. 

It didn’t take long for the impact to show up on the shelves — or, in this case, the product listings. Within just 5 days, availability for products sourced from China dropped from 83% to 74% and by March 8, it fell further to 64%, a nearly 20% drop in availability in less than 10 days. This sudden drop raised eyebrows. Was it a supply disruption? A shift in sourcing? Anticipation of the tariff? Whatever the reason, the impact was immediate. It may point to suppliers rushing to sell off existing inventory before the tariff took effect. Alternatively, it could reflect delays or halts in new shipments due to disruptions or uncertainty after the announcement. In contrast, Vietnam-sourced products experienced a short-lived dip in late January, but from early February onward, their inventory stayed stable around 85% with no sustained dips as seen in China.

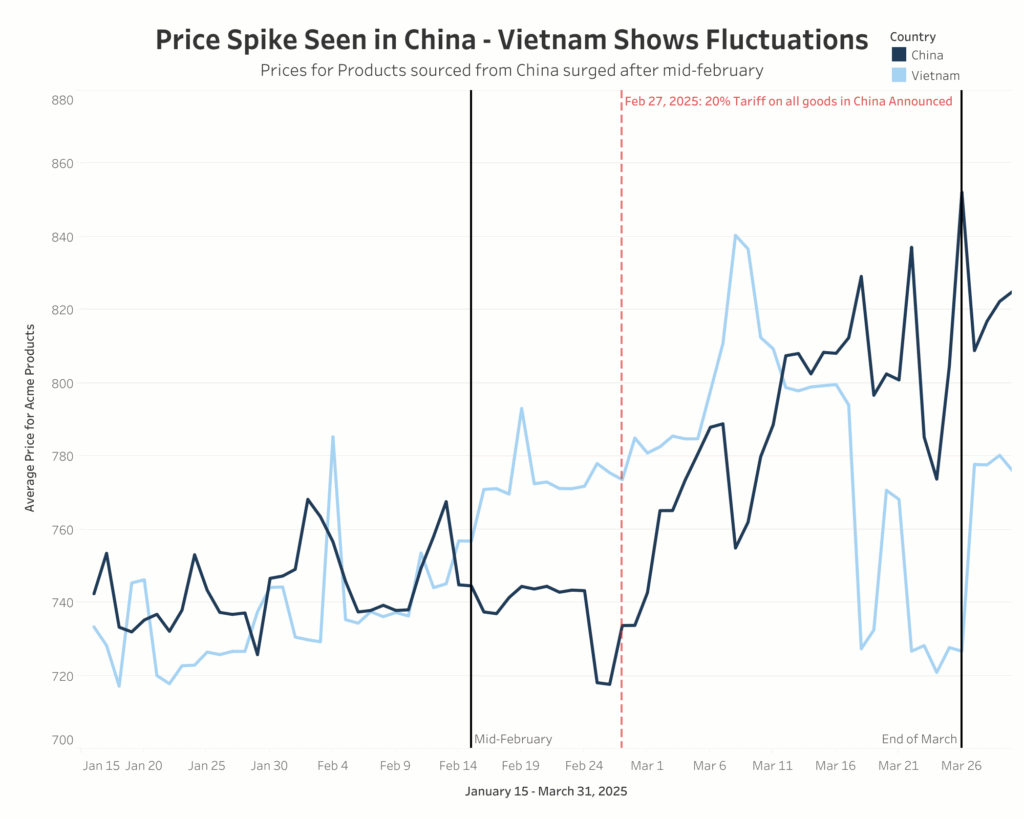
Then came the price movement, and it wasn’t subtle. Following the sharp drop in availability for China-sourced products, prices began to shift as well. Around mid-February, even before the second tariff was officially announced, we started seeing a gradual rise. What had been a stable average of around $750 climbed steadily, crossing the $800 mark by early March. After the February 27 announcement, the trend intensified, with prices reaching close to $860 by the end of March. This behavior suggests that sellers were not only anticipating higher import costs but were also starting to pass them along, either to preserve margins or test how much price movement the market would absorb. 

Products sourced from Vietnam showed some fluctuations and spikes, particularly around mid-February and early March, even reaching close to $840 at one point, but these weren’t sustained. Prices quickly fell back down and mostly hovered between $760–780, occasionally dipping to the $720–760 range by late March. While the line was volatile, there was no clear upward trend through the period, suggesting that Vietnam remained relatively insulated from tariff-driven pricing pressures, at least for now.

The Delayed Reaction: Vietnam’s Steady Climb

April-June

As we moved into Q2, things began to shift more visibly — and this time, Vietnam wasn’t sitting still.

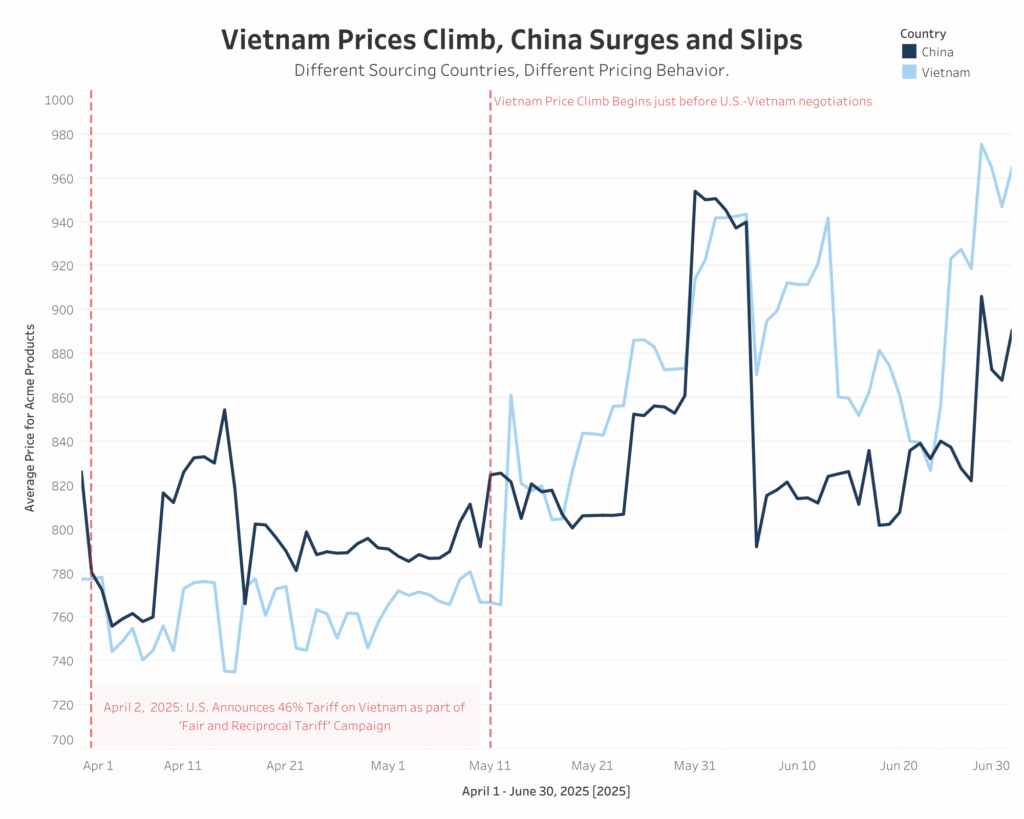
Throughout early April, products sourced from China remained elevated, holding steady around the $850 mark. This wasn’t entirely unexpected. With the U.S. imposing steep reciprocal tariffs on Chinese goods, up to 125% by April 9. Those levels held firm until around May 31–June 5, when prices took another sharp jump, briefly spiking toward $950 before settling back into the $830–850 range.  

Vietnam, on the other hand, told a quieter but persistent story. For most of April, Vietnamese products stayed under $770, showing no major deviation, even after the potential 46% tariff on Vietnamese goods in early April. That changed after May 11. Just days before formal U.S.-Vietnam negotiations began in Washington, we started seeing a clear, upward shift in prices. It wasn’t a spike; it was a steady climb. From mid-May to the end of June, Vietnamese prices rose consistently, ultimately pushing past $900. No sudden drops. No dramatic surges. Just a slow, confident march upward — one that suggests pricing adjustments were being made gradually, perhaps in anticipation of long-term cost changes, or as suppliers adapted to the shifting trade environment.

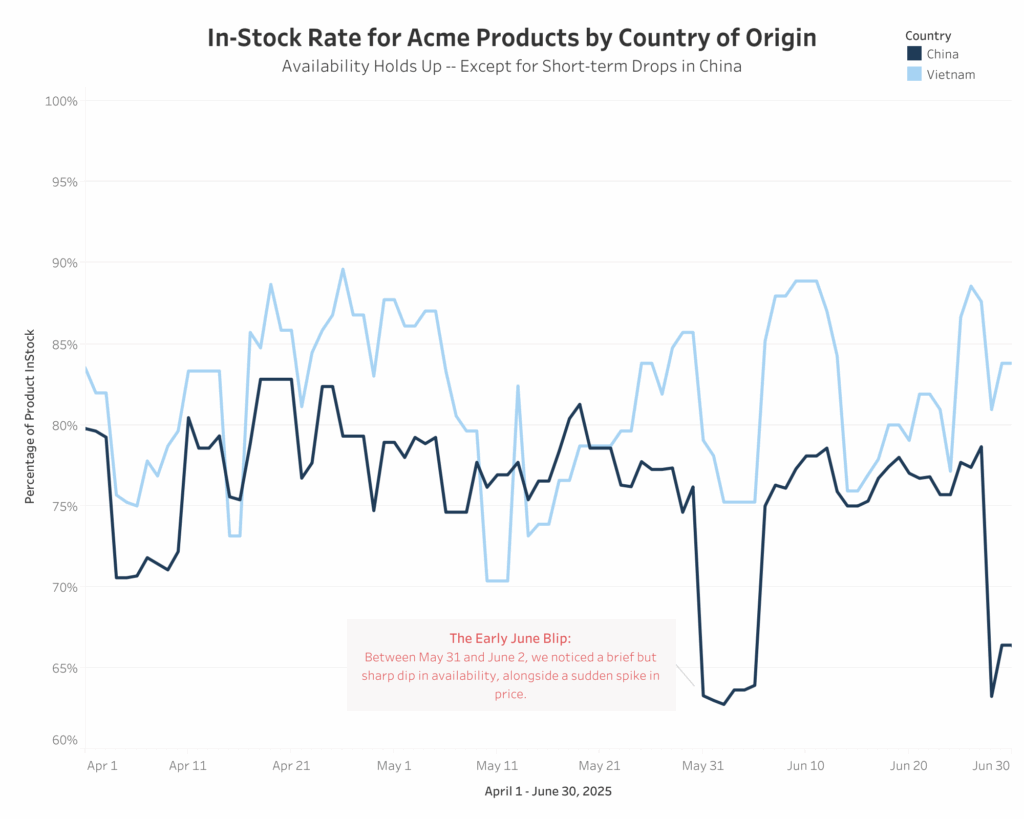
When we look at in-stock rates, the contrast is surprisingly calm. China-sourced products held steady between 75–80% availability across most of Q2, without the dramatic dips we saw back in March. Earlier, we noticed a sharp but temporary spike in prices from May 31-June 5, and we see there’s a similar and slight dip around the same time in product availability for China. Neither the price spike nor the stock drop lasted long, but the overlap raises questions. Was it a momentary stockout? A rush in orders? Or just a pricing overreaction? We can’t say for sure, but this short-lived bump reminds us how fast markets can respond to even the hint of disruption, especially when trade policy is already in flux.

Vietnam, on the other hand, maintained strong availability throughout, hovering around or above 85%, with no major stock issues observed. That stability makes the consistent price climb even more interesting. Unlike the case with China, there wasn’t a supply squeeze driving the rise, no sudden dips in availability to explain the shift. Instead, the data points to something more deliberate. 

The fact that prices rose while in-stock rates remained high suggests that sellers weren’t reacting to shortages — they were responding to perceived risk. With the U.S. floating a potential 46% tariff on Vietnamese goods in April and entering tense negotiations by mid-May, the increase in prices was likely less about immediate disruptions and more about gradual supplier adjustments — a way to prepare for possible cost increases and ongoing trade uncertainty. In other words, Vietnam’s rising prices weren’t a reaction to disruption — they were a signal of expectation. That slow, steady climb aligns with a market adjusting proactively, not defensively. And in a way, it reinforces just how differently the two supply chains, China and Vietnam, absorbed the shock of Q2’s tariff tensions.

While China’s pricing story was volatile and reactive, Vietnam’s was patient but firm. And that distinction — fast shock versus slow adaptation — might hint at deeper differences in how these sourcing pipelines absorb and respond to policy uncertainty.

“Tariffs don’t show up in strategy decks. They show up on product pages. Our Rainforest API caught it in real time. China’s supply chain took a hit fast. Vietnam climbed slow and steady. This stuff doesn’t scream. It whispers. And if you’re not watching closely, you miss it. Brands need to be tracking live data at the SKU level. Otherwise, you’re making decisions blind. The shelf is shifting whether you’re looking or not.”

– Ria Delamere, CTPO at Traject Data

Bringing Clarity to Chaos: Traject Data’s Role in Ecommerce Monitoring

This kind of granular, real-time analysis wouldn’t be possible without reliable ecommerce APIs — and that’s exactly where Traject Data comes in. With access to live and historical product data across major retailers like Amazon, Walmart, and Target, Traject Data’s SERP and ecommerce APIs make it easy to track price shifts, stock changes, and competitive movements as they happen. Whether you’re monitoring tariff impacts, analyzing supplier behavior, or forecasting future disruptions, our data helps you see the story unfolding at the product level — not just in policy papers. In an environment where global trade policy can shift overnight, having this level of visibility is more than useful — it’s essential.

Sources

Traject Data is Your Premier Partner in Web Scraping


Join thousands of satisfied users worldwide who trust Traject Data for all their eCommerce and SERP data needs. Whether you are a small business or a global enterprise, our entire team is committed to helping you achieve your goals and stay ahead in today's dynamic digital landscape. Unlock your organization's full potential with Traject Data. Get started today.

Get started today